This started as an experiment: What if I paired with Claude to explore a massive open dataset, using SQL as the primary interface - not just on the backend, but in the browser itself?
The result: a map viewer that queries Overture Maps' 2.3 billion features directly from S3, entirely in the browser. No backend. No database server. Just SQL running in a browser tab.
Live demo: maps.marchen.co
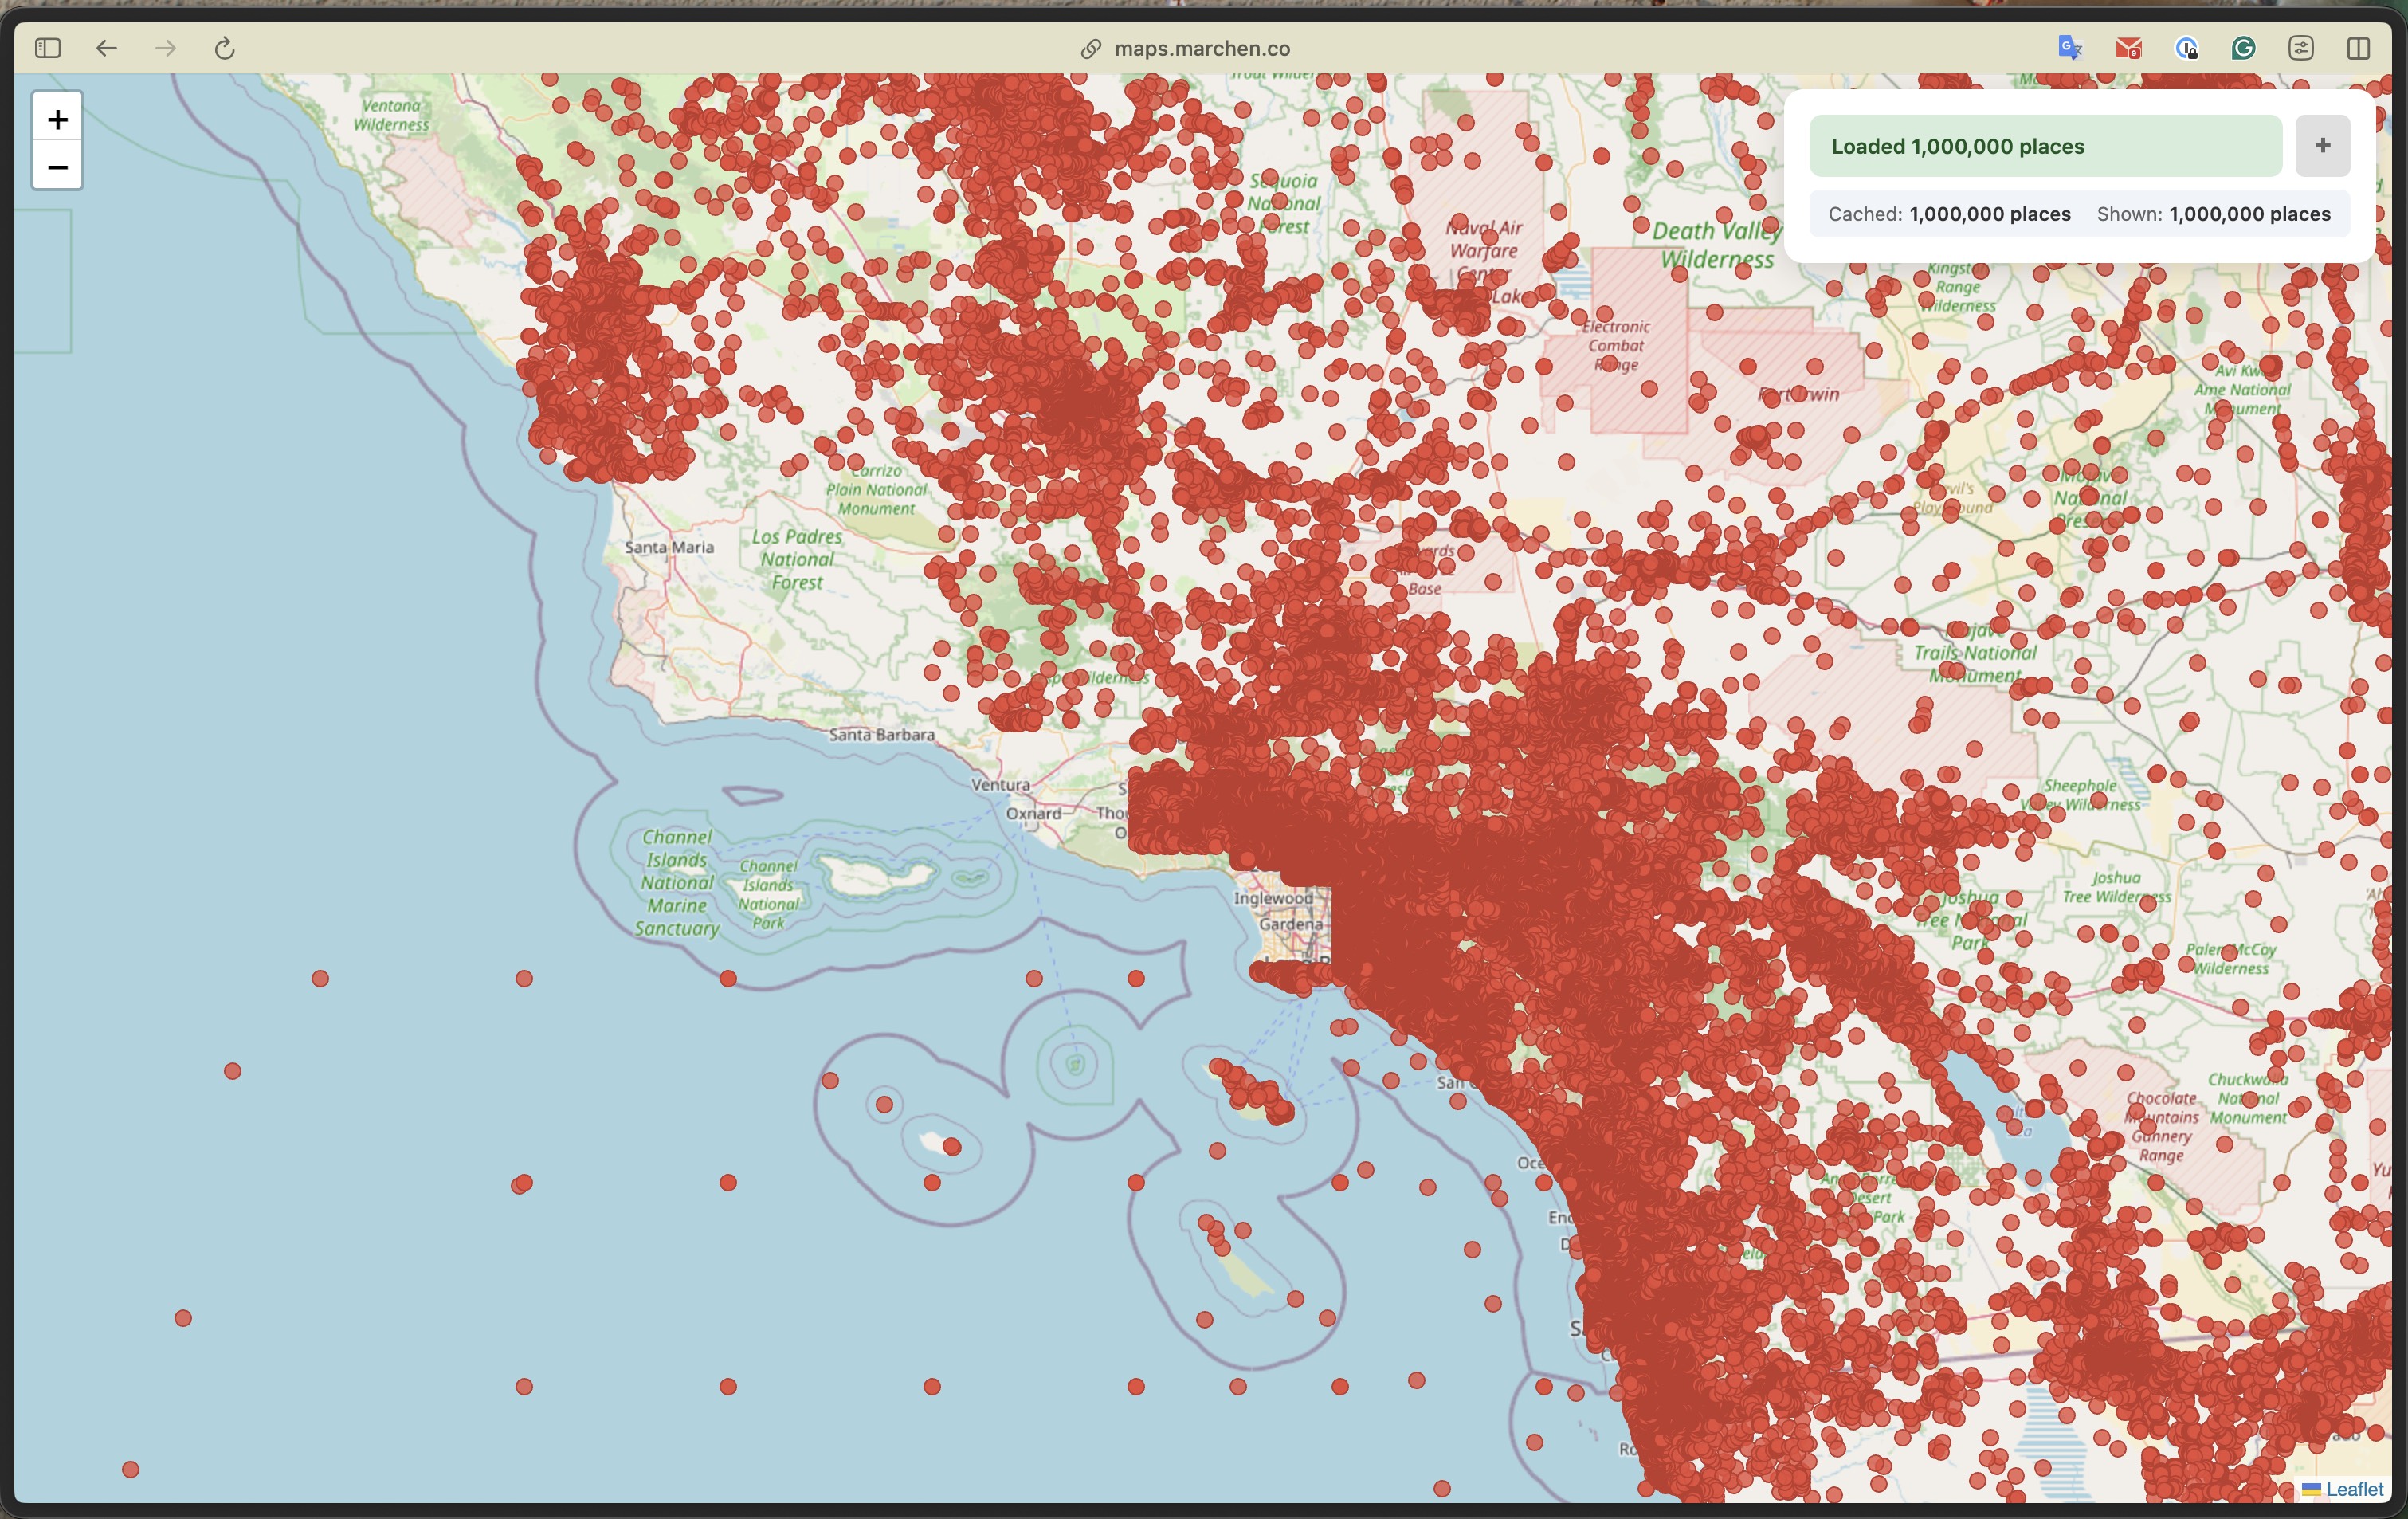
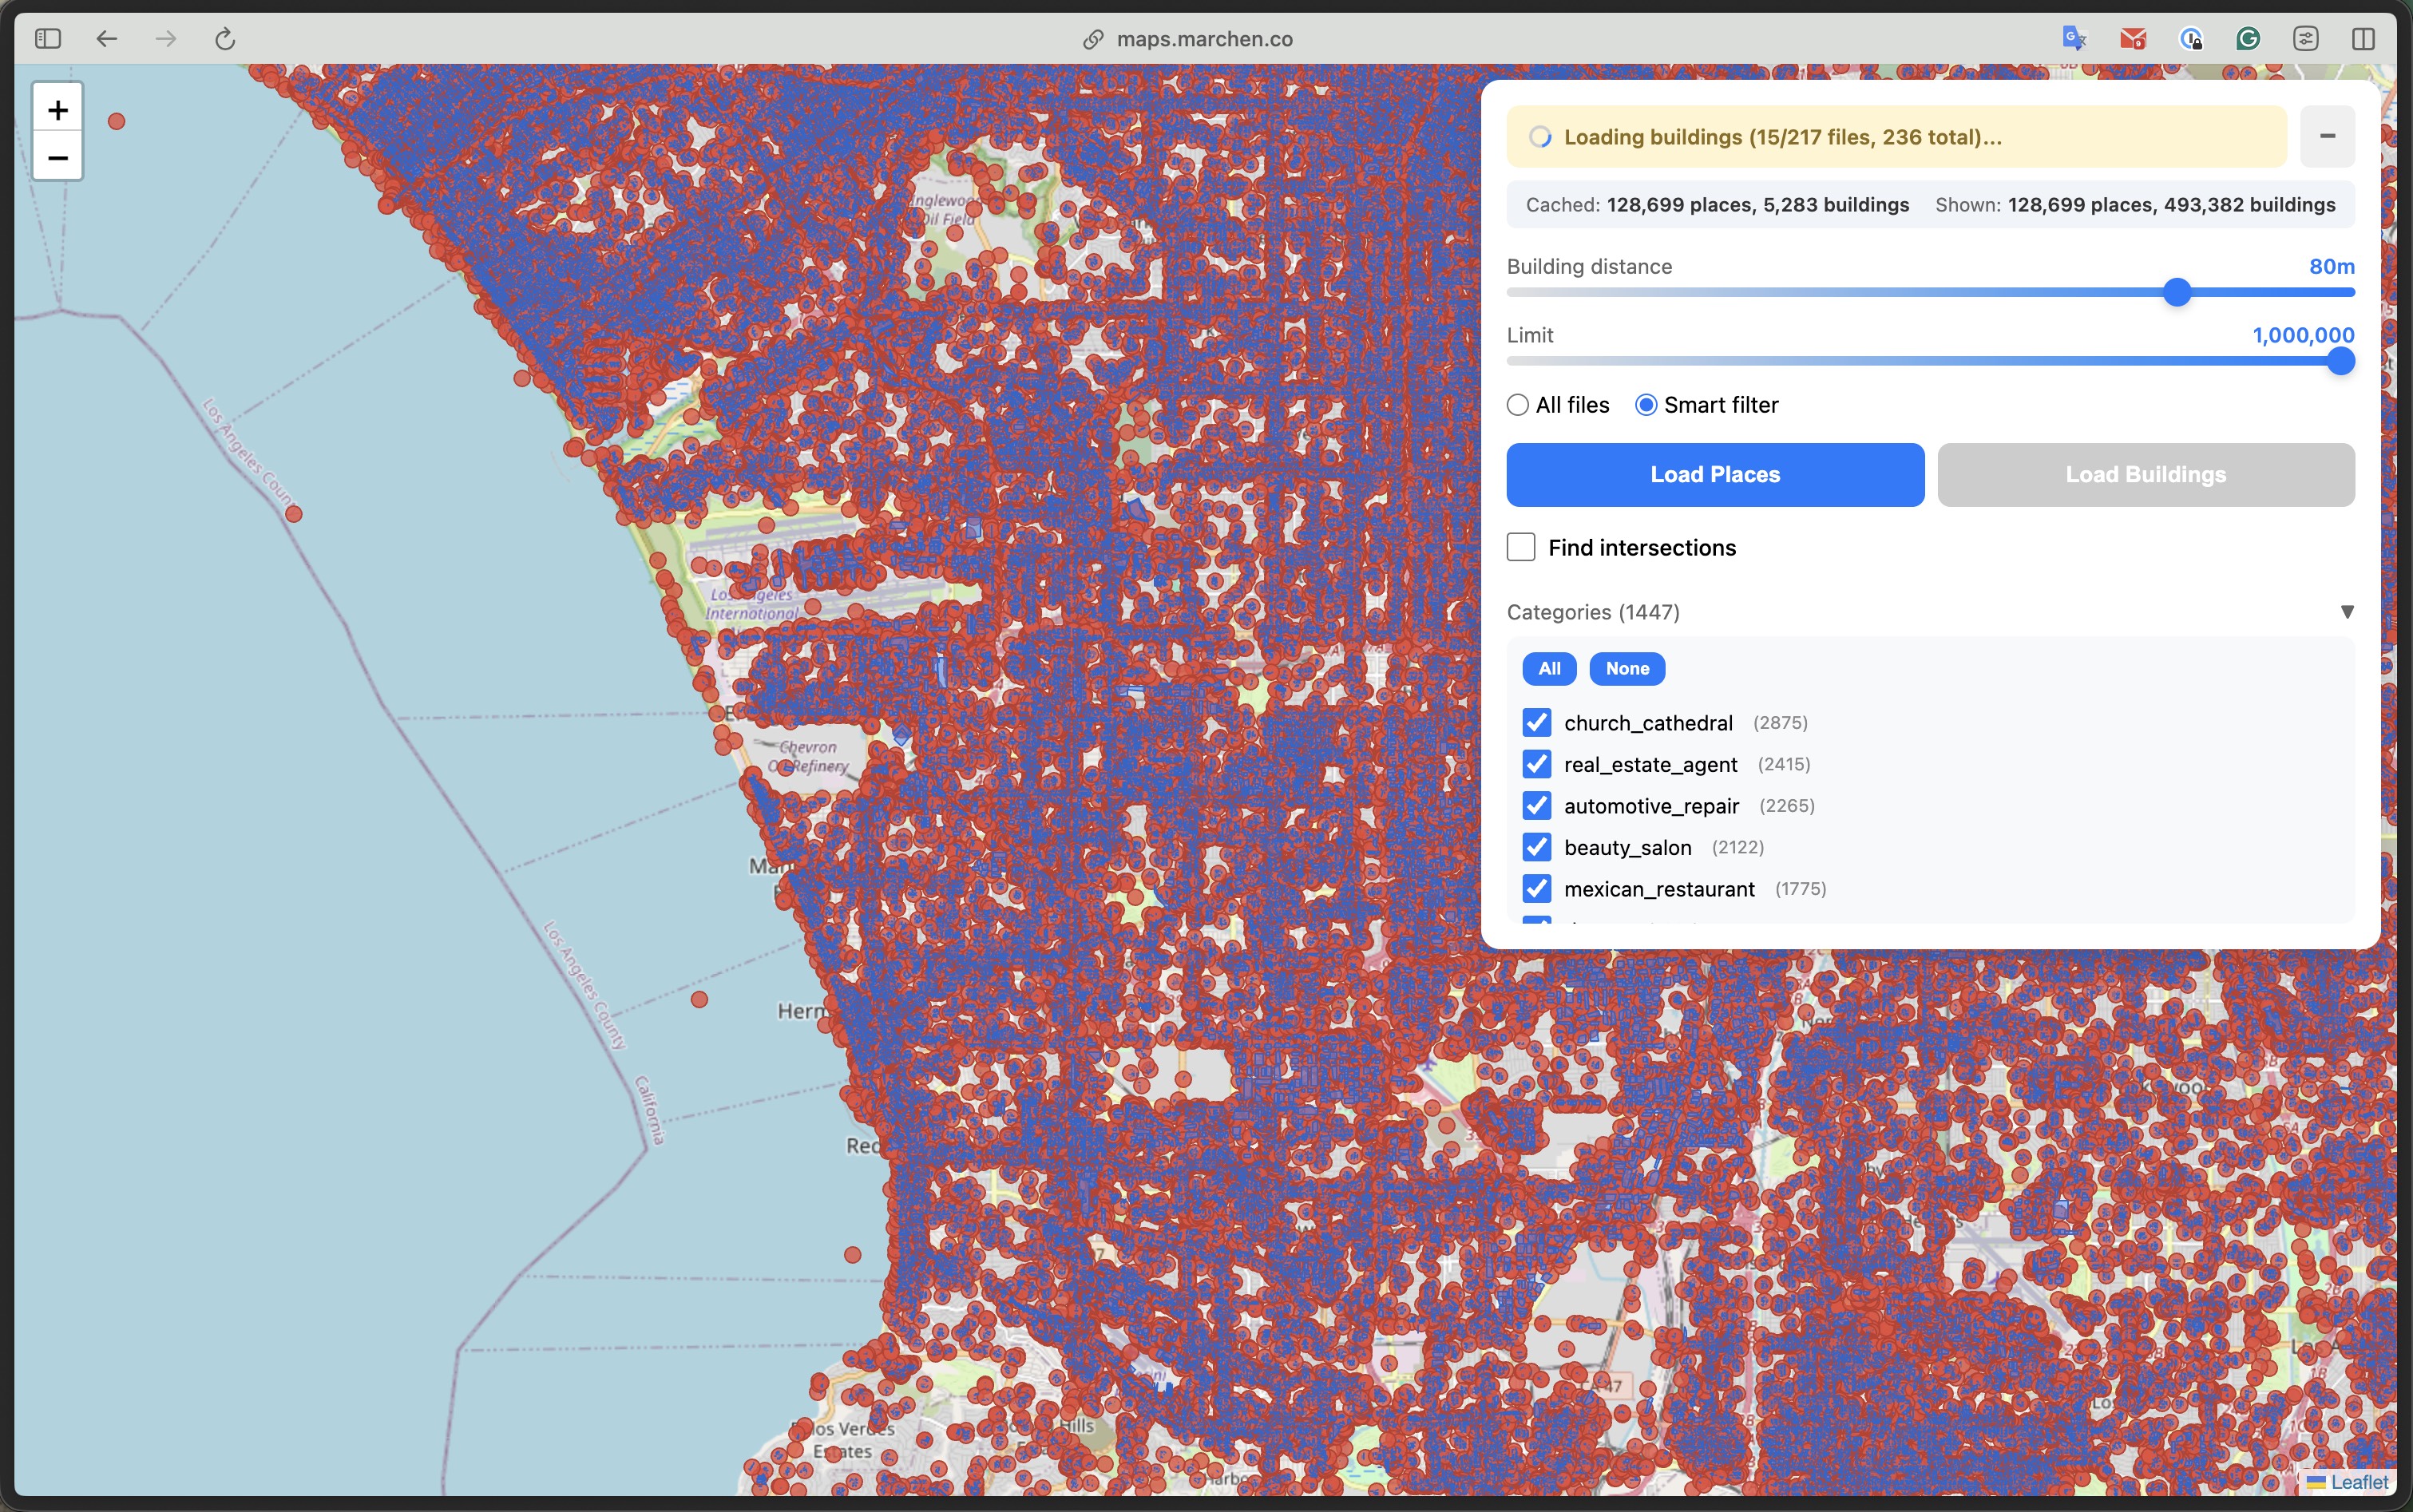
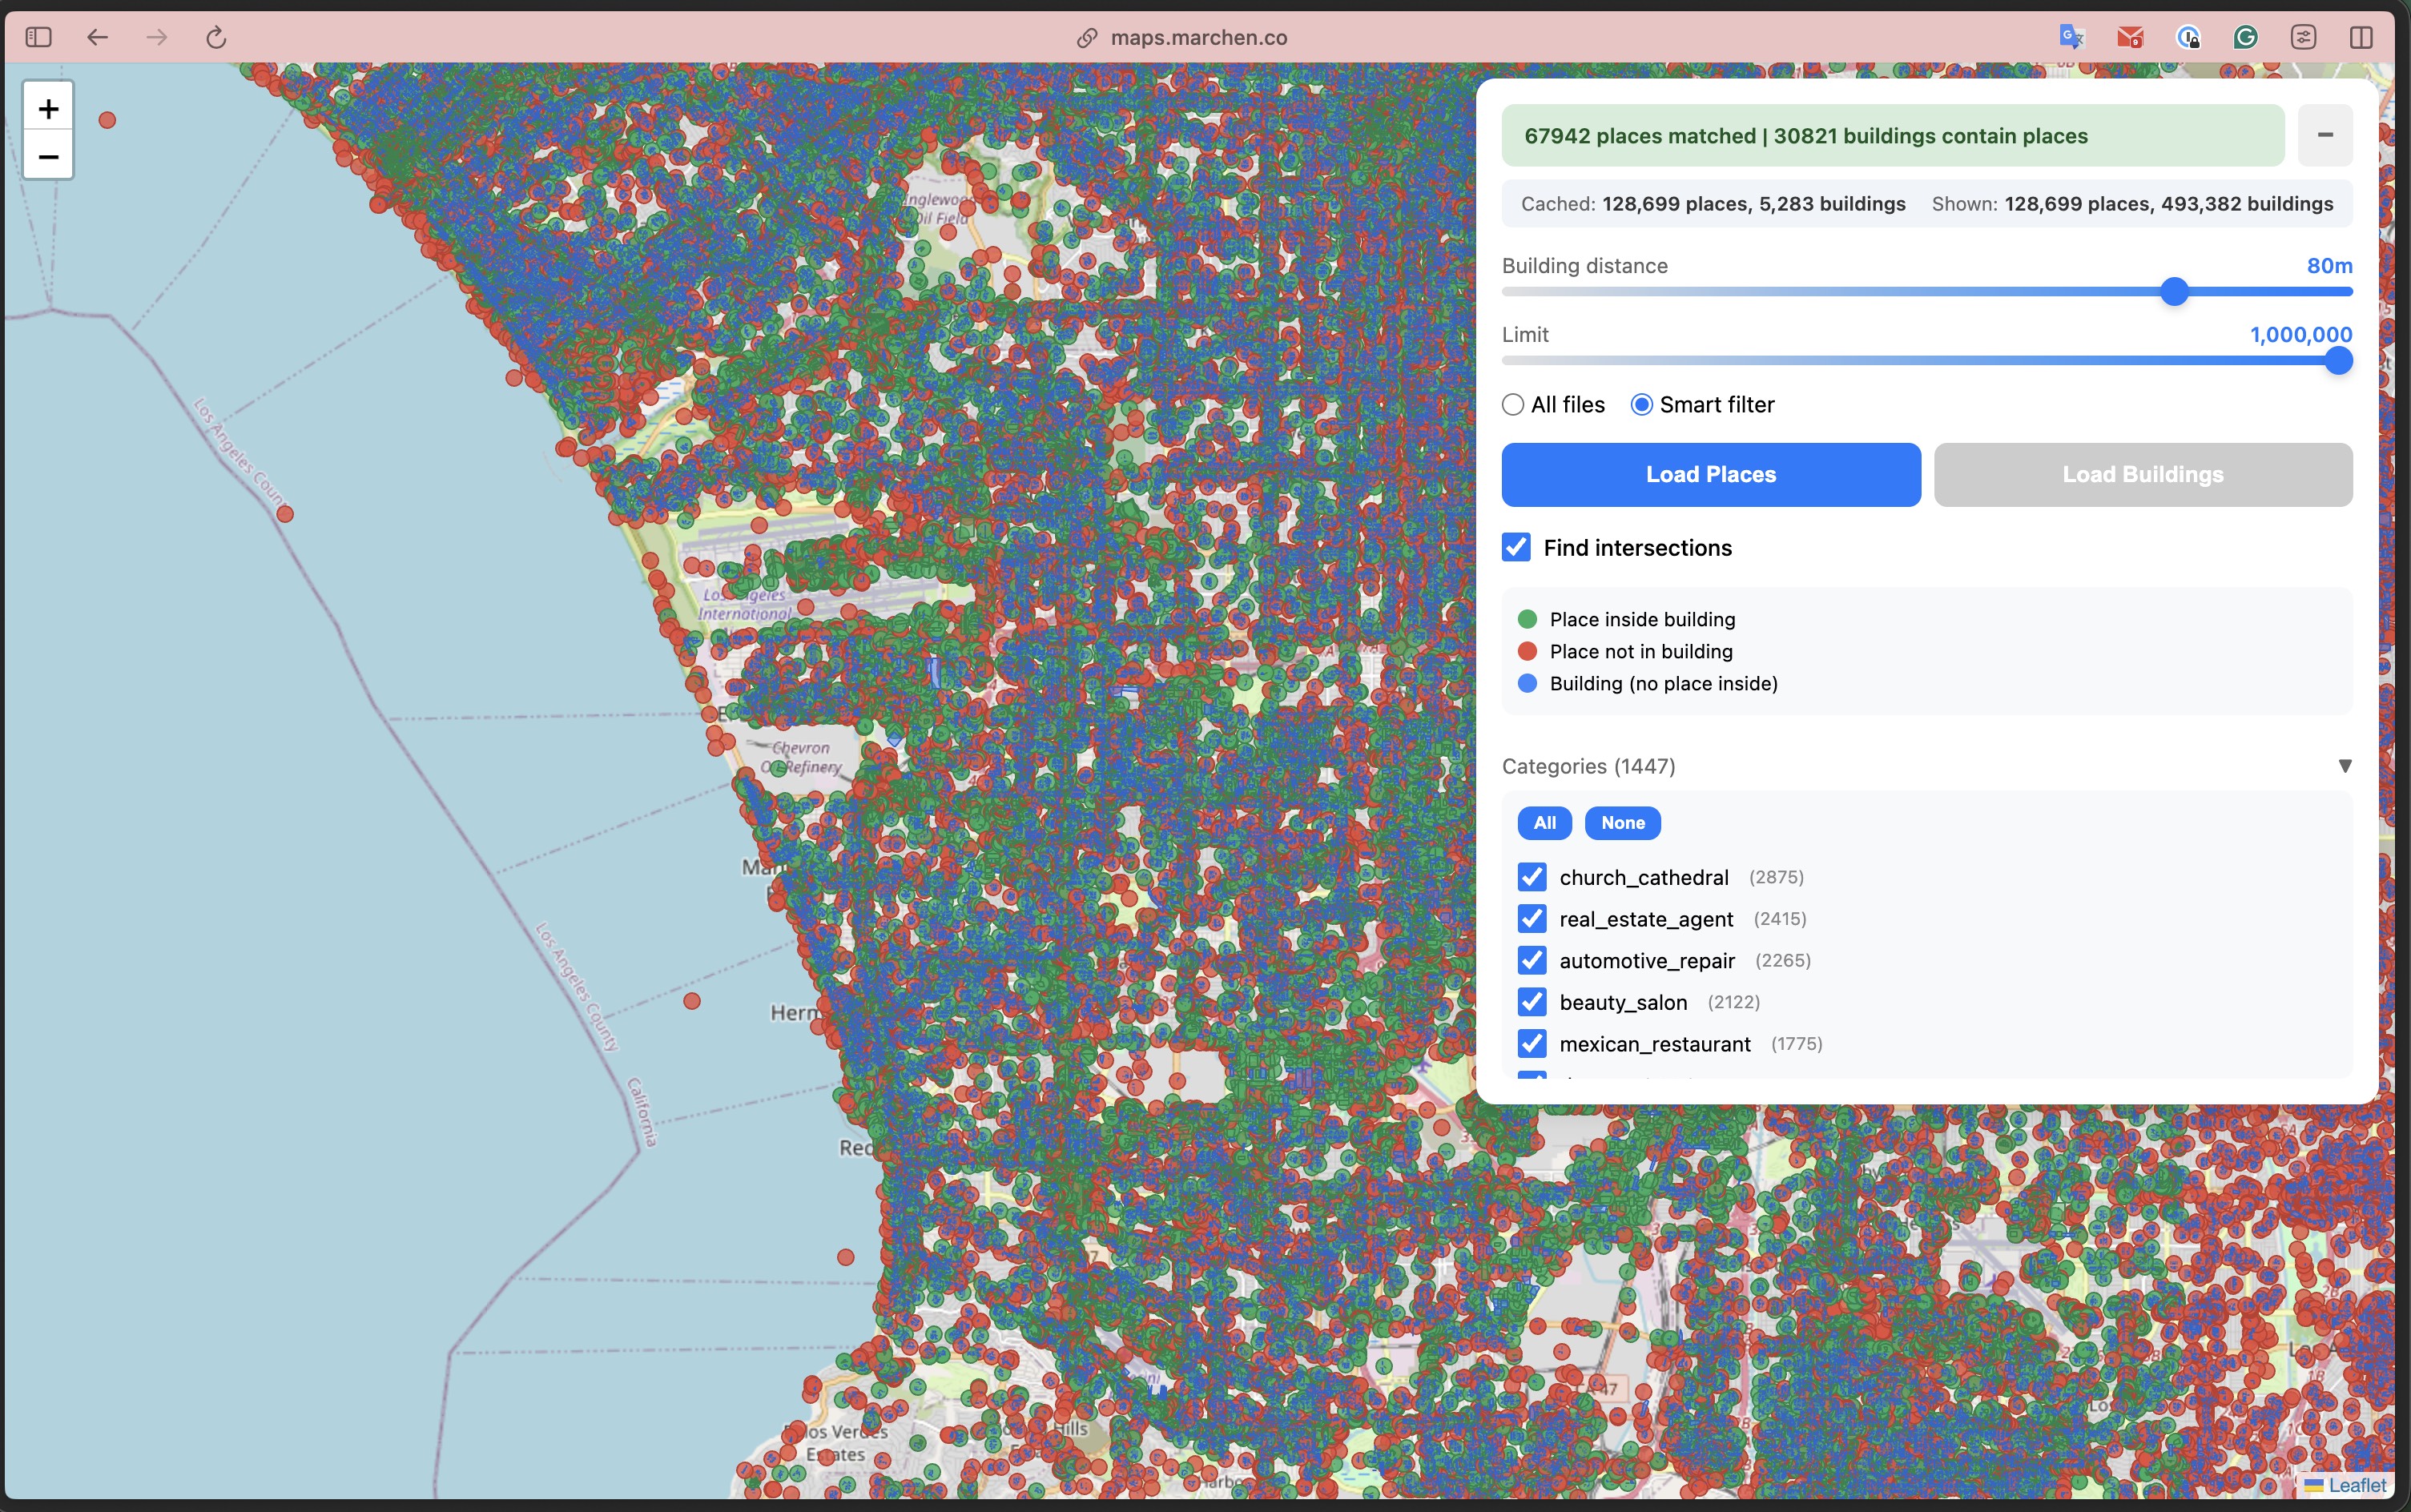
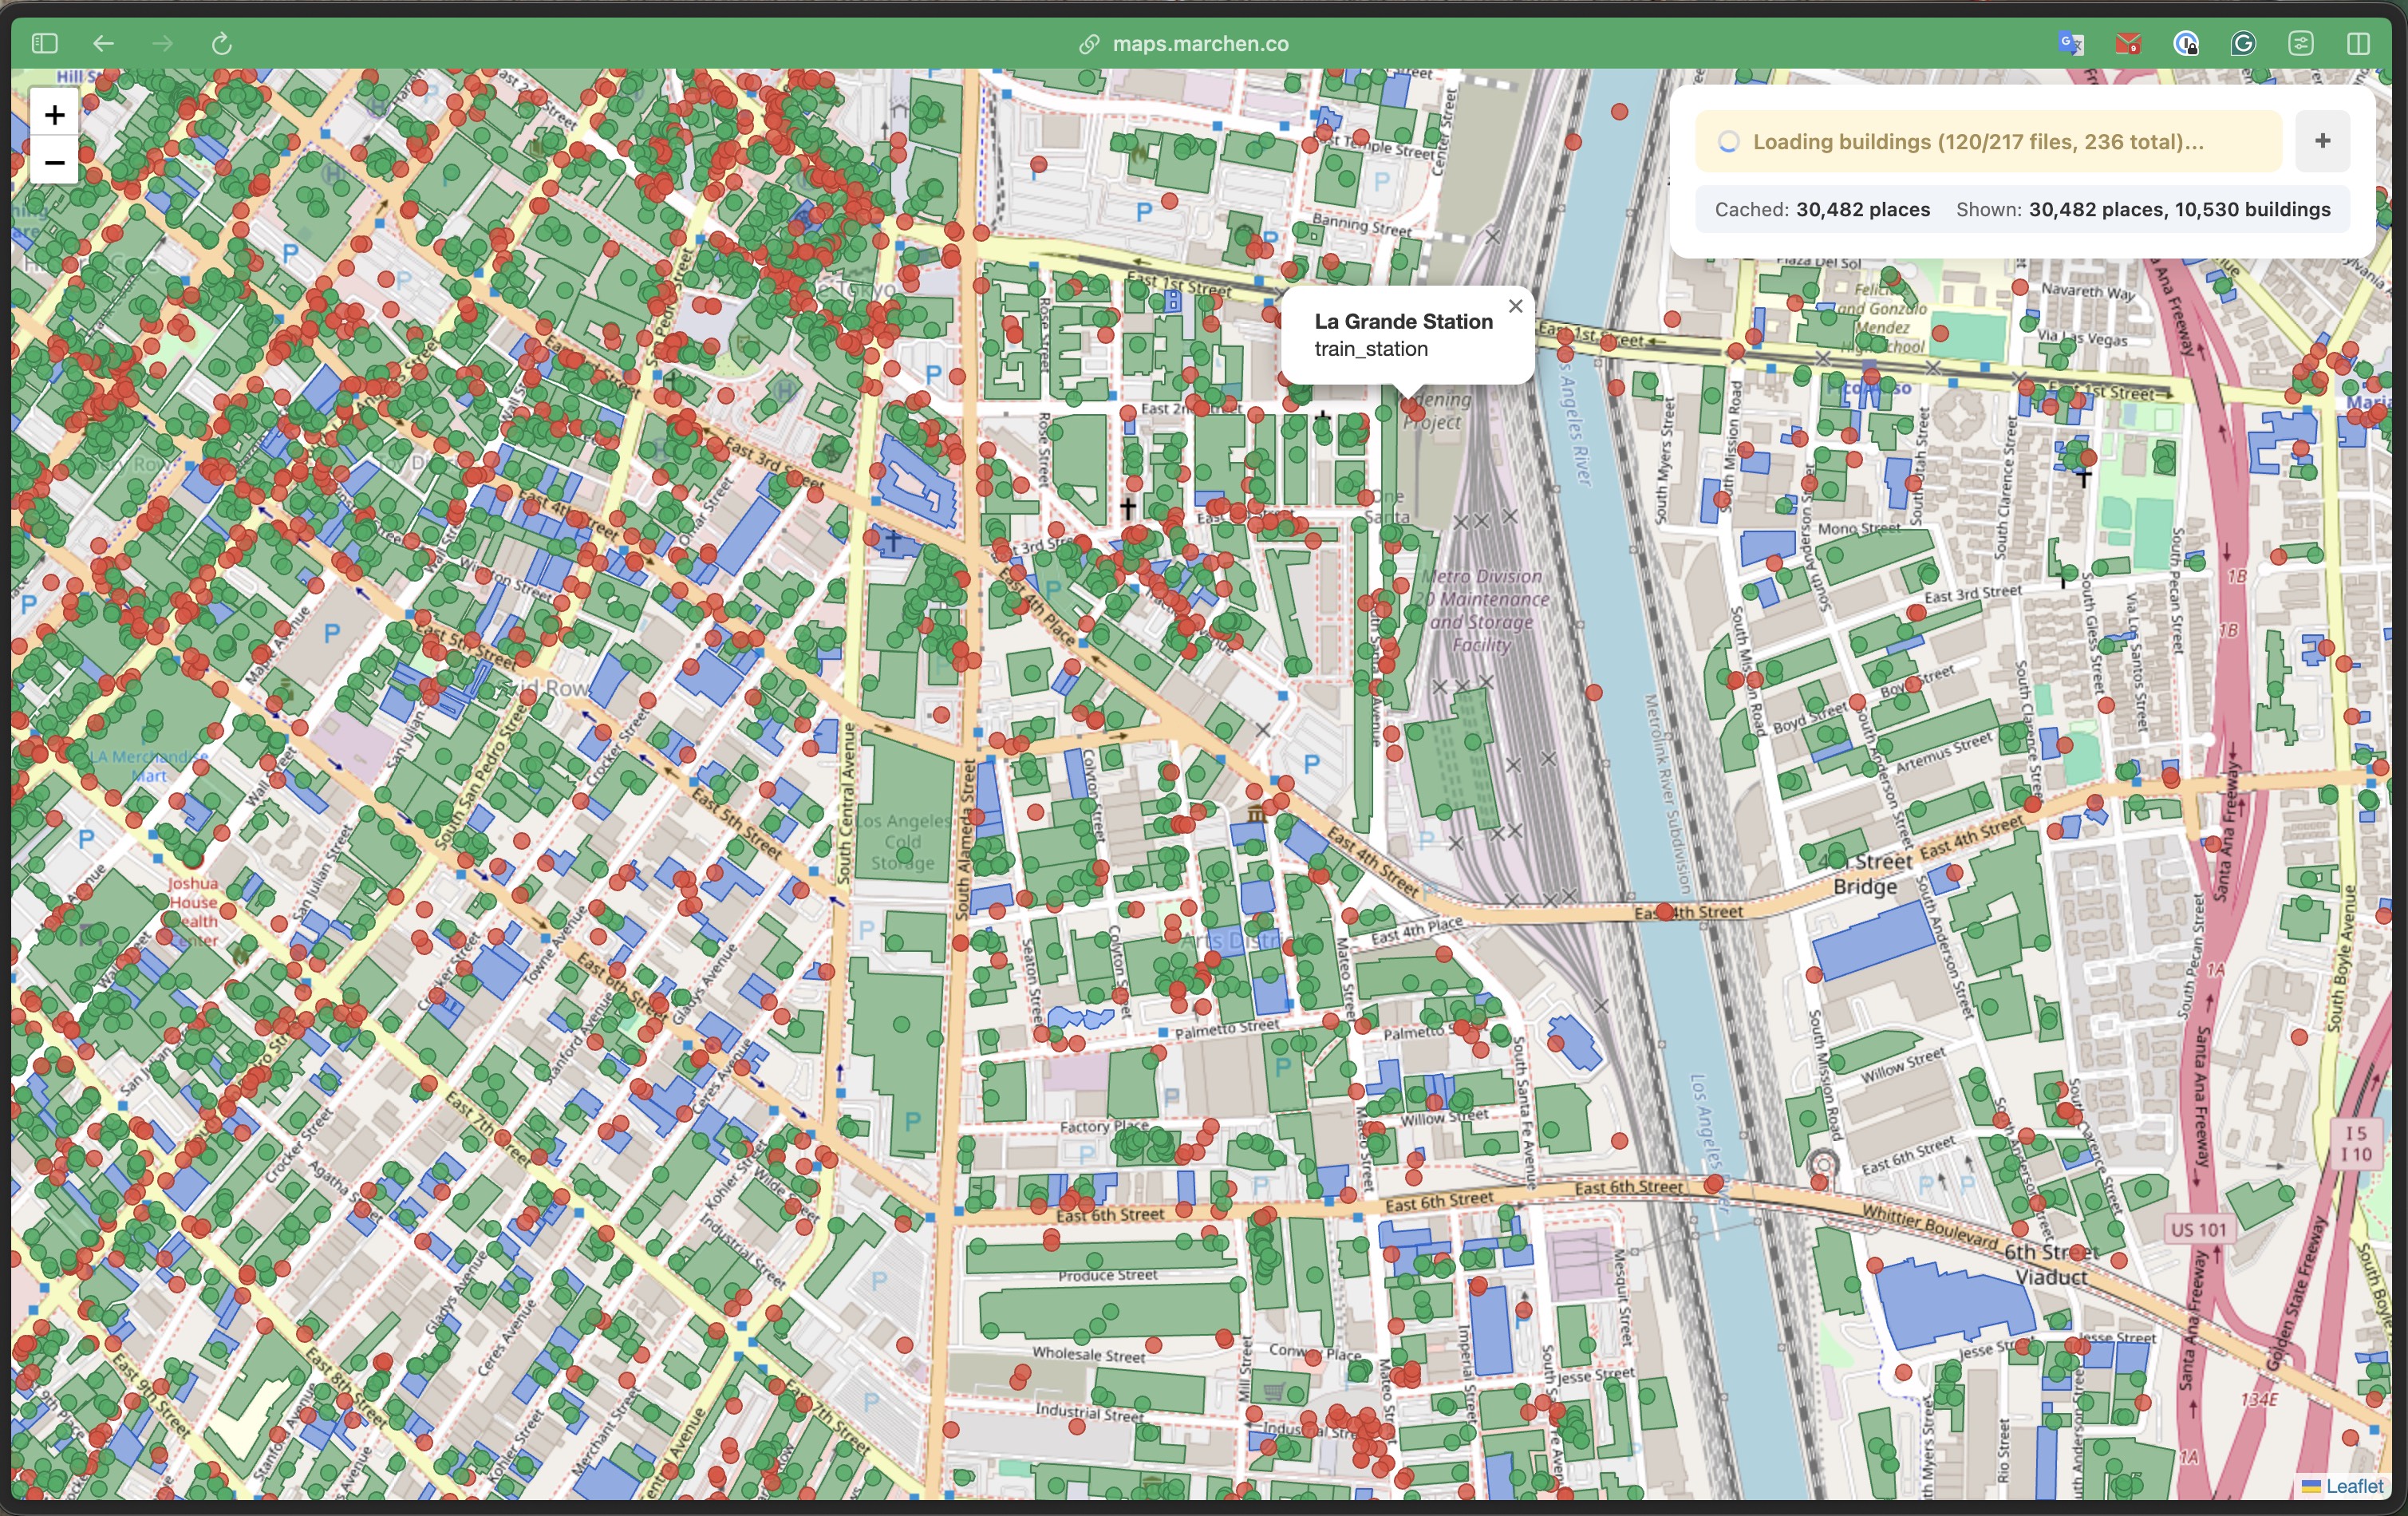
From left: 1M places across SoCal | 128K places + 493K buildings in browser | Spatial join results | Building-level detail with popups
The Experiment
I wanted to test four ideas at once:
Claude as an autonomous explorer - I've been building an AI agent in my home lab that can autonomously explore codebases and experiment with my guidance. Could it help me navigate unfamiliar territory like DuckDB-WASM and Cloudflare Durable Objects?
Open data without infrastructure - Overture Maps publishes 500GB+ of geospatial data as open Parquet files. Could I use it directly without importing into my own database?
SQL-first frontend - What if SQL wasn't just for the backend? What if the browser became a SQL client, and "state management" was just... queries?
Learning Cloudflare's edge platform - I'd heard about Workers, Durable Objects, and Pages but never used them. Could I learn the platform while building something real?
The Traditional Approach (and Why I Skipped It)
Typically, to build a geospatial viewer you'd need:
- PostgreSQL with PostGIS
- An API server (Node, Python, Go...)
- Data import pipelines
- Infrastructure to manage
For Overture Maps' 500GB+ dataset, that means significant storage, memory, and ongoing maintenance.
I wanted something different: minimum infrastructure cost, minimum labor.
The Architecture
The entire stack:
- Cloudflare Pages - static HTML/JS/CSS (free)
- Cloudflare Worker - CORS proxy + spatial index (~1,500 range requests per full load with buildings, free tier handles ~66 loads/day; $5/mo for 10M requests)
- DuckDB-WASM - SQL engine running in the browser
- Overture Maps S3 - public Parquet files (no cost to me)
Total infrastructure cost: $0/month
DuckDB-WASM: SQL in the Browser
DuckDB-WASM is a full analytical SQL engine compiled to WebAssembly. It can query Parquet files directly via HTTP - no data import needed.
import * as duckdb from '@duckdb/duckdb-wasm';

const db = new duckdb.AsyncDuckDB(...);
const conn = await db.connect();

// Query Parquet files directly from S3
const result = await conn.query(`
  SELECT names.primary as name, categories.primary as category
  FROM read_parquet('https://proxy/release/.../places.parquet')
  WHERE bbox.xmin >= -118.5 AND bbox.xmax <= -118.0
  LIMIT 1000
`);
That's it. No ETL, no database setup, no API endpoints.
GeoParquet: The Format That Makes This Possible
GeoParquet is Parquet with standardized geometry encoding. Overture Maps publishes their entire dataset as GeoParquet files on S3, organized by theme:
s3://overturemaps-us-west-2/release/2026-01-21.0/
  theme=places/type=place/          # 8 files, ~1GB each, 60M+ POIs
  theme=buildings/type=building/    # 236 files, 2.3B footprints
  theme=divisions/type=division/    # country/state boundaries
  ...
Each file contains a bbox struct with xmin, xmax, ymin, ymax - the bounding box of all geometries in that file. This metadata is stored in Parquet row group statistics, readable without downloading the actual data.
The geometry column uses WKB (Well-Known Binary) encoding, which DuckDB's spatial extension understands natively:
-- DuckDB can parse WKB geometry and run spatial functions
SELECT ST_X(geometry) as lon, ST_Y(geometry) as lat,
       ST_Contains(building.geometry, place.geometry) as inside
FROM places, buildings
The Key Insight: HTTP Range Requests
When configured properly, DuckDB can use HTTP range requests to fetch only the data it needs from Parquet files:
- Footer first - reads file metadata (~few KB)
- Column statistics - checks min/max values to skip irrelevant row groups
- Targeted fetches - downloads only matching data chunks
A 1GB Parquet file might result in just a few MB of actual transfer for a small bounding box query.
The tradeoff: each file requires multiple range requests (footer, metadata, row groups). The exact count varies by file size and structure - large place files need ~17 requests each, while building files average ~7. Loading all 217 building files means ~1,500 HTTP requests. The data transfer is efficient, but request count adds up.
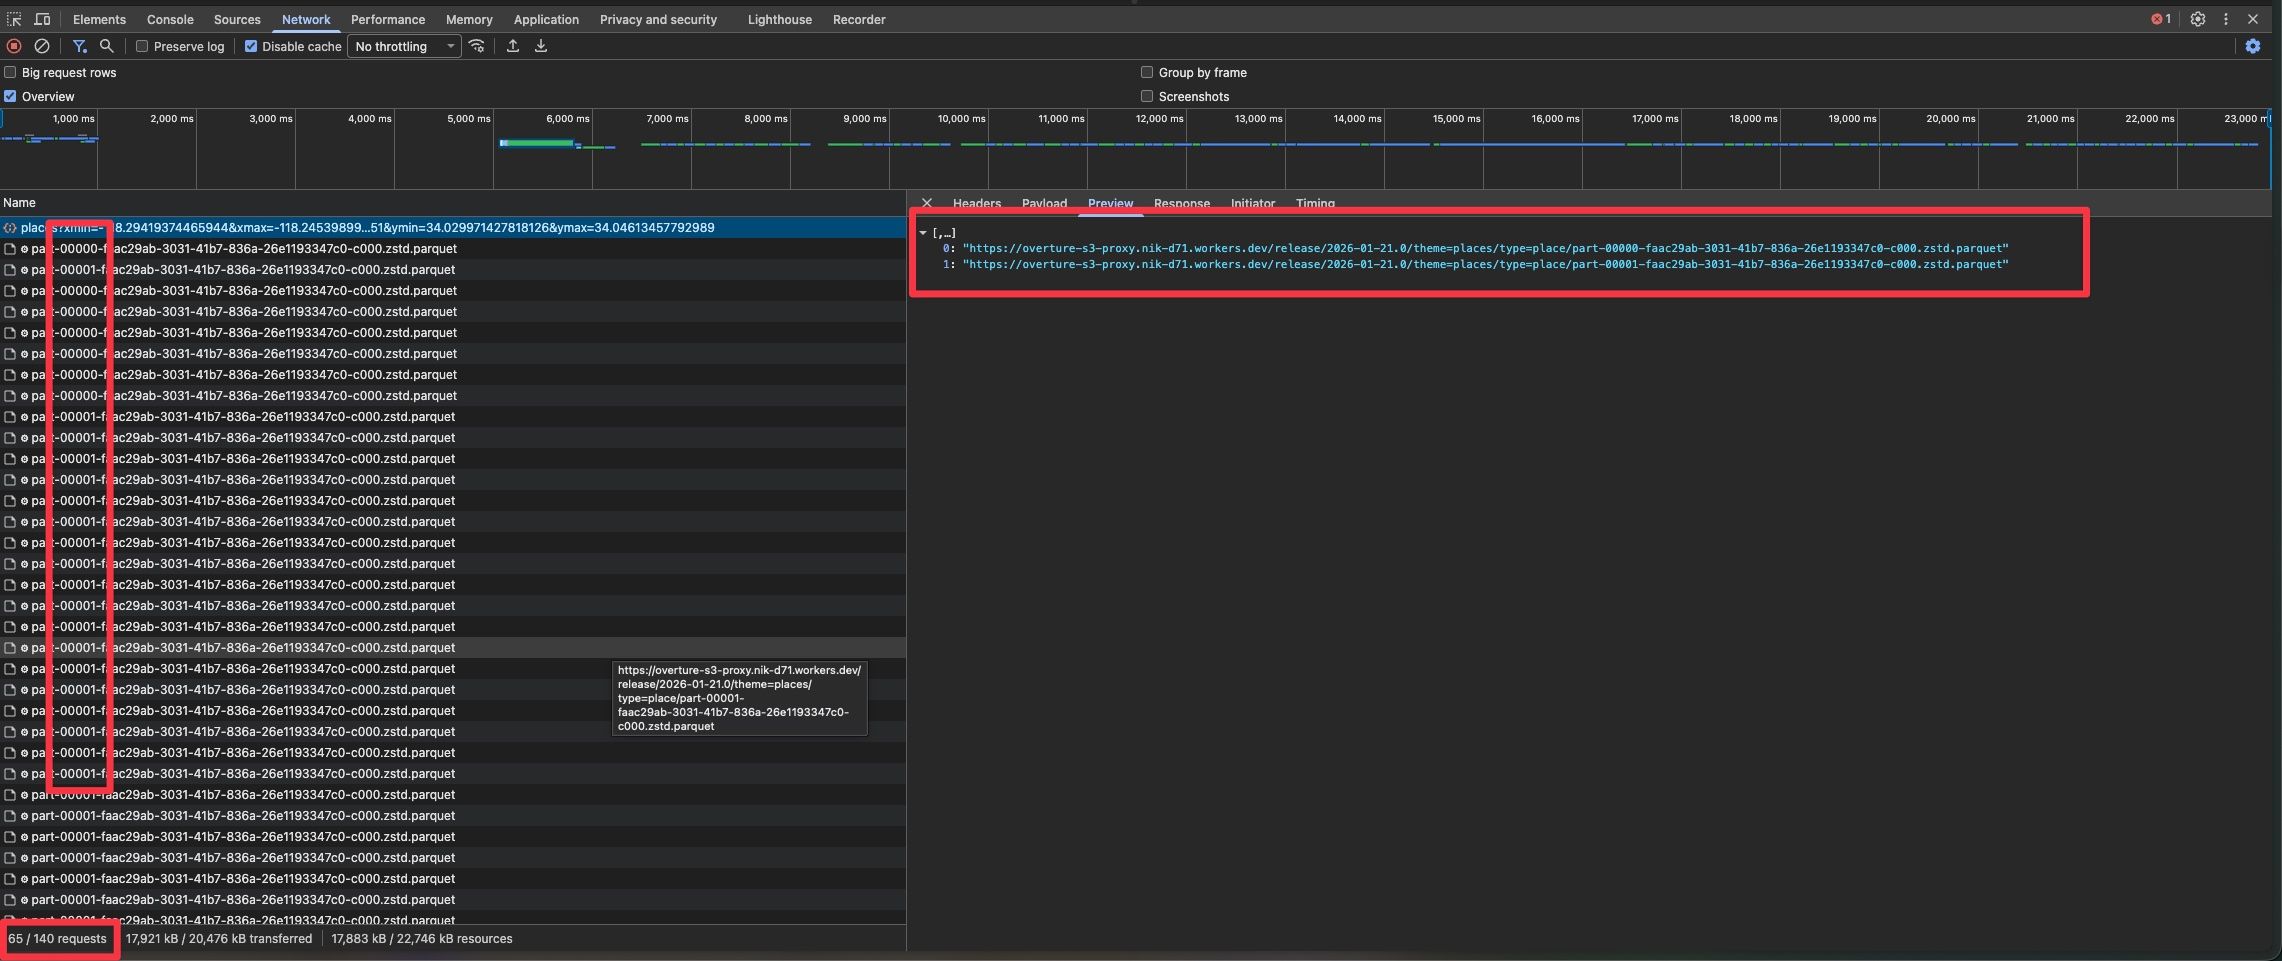
DevTools Network tab: multiple range requests to the same parquet file. Loading 8 place files (~1GB each) generates 140 requests. The data transfer is small (17MB), but request count is the cost of querying Parquet over HTTP.
Frontend as SQL Consumer
Here's where it gets interesting. Instead of traditional frontend state management, the UI directly reflects SQL query results:
async function loadPlaces() {
  const bbox = map.getBounds();

  await conn.query(`
    CREATE TABLE places AS
    SELECT id, names.primary as name, categories.primary as cat,
           ST_X(geometry) as lon, ST_Y(geometry) as lat
    FROM read_parquet([${files}])
    WHERE bbox.xmin >= ${bbox.west} AND bbox.xmax <= ${bbox.east}
      AND bbox.ymin >= ${bbox.south} AND bbox.ymax <= ${bbox.north}
    LIMIT ${limit}
  `);

  const rows = await conn.query(`SELECT * FROM places`);
  // Render to map...
}
The places table becomes local state. Need to filter? Just query it:
async function findIntersections() {
  // Find places that are inside buildings using spatial SQL
  const placesWithBuildings = await conn.query(`
    SELECT DISTINCT p.id FROM places p
    JOIN buildings b ON b.bbox.xmax >= p.lon AND b.bbox.xmin <= p.lon
                    AND b.bbox.ymax >= p.lat AND b.bbox.ymin <= p.lat
    WHERE ST_Contains(b.geometry, p.geometry)
  `);
  // Color matched places green, unmatched red
}
No Redux, no state management libraries - just SQL.
Green = places inside buildings (67,942 matched). Red = places without building footprints. Blue = buildings without places inside. The status bar shows the SQL join completed: "67942 places matched | 30821 buildings contain places".
Caching Strategy
Spatial caching with in-memory tables:
let placesBbox = null;

if (bboxContains(placesBbox, currentBbox)) {
  // Query local table - instant
  await conn.query(`SELECT * FROM places WHERE ...`);
} else {
  // Fetch from S3 - slower
  await conn.query(`CREATE TABLE places AS SELECT ... FROM read_parquet(...)`);
  placesBbox = currentBbox;
}
Data is cached per bounding box. When you zoom into a subset of the cached area, there's no network request - the map just renders the visible portion. Pan outside the cached region, and it fetches fresh data.
The real win: category filtering. Once places are loaded, we group them by category and build a checkbox UI with counts. Toggling "jewelry_store (952)" instantly shows or hides those 952 markers - no SQL query needed, just layer visibility.
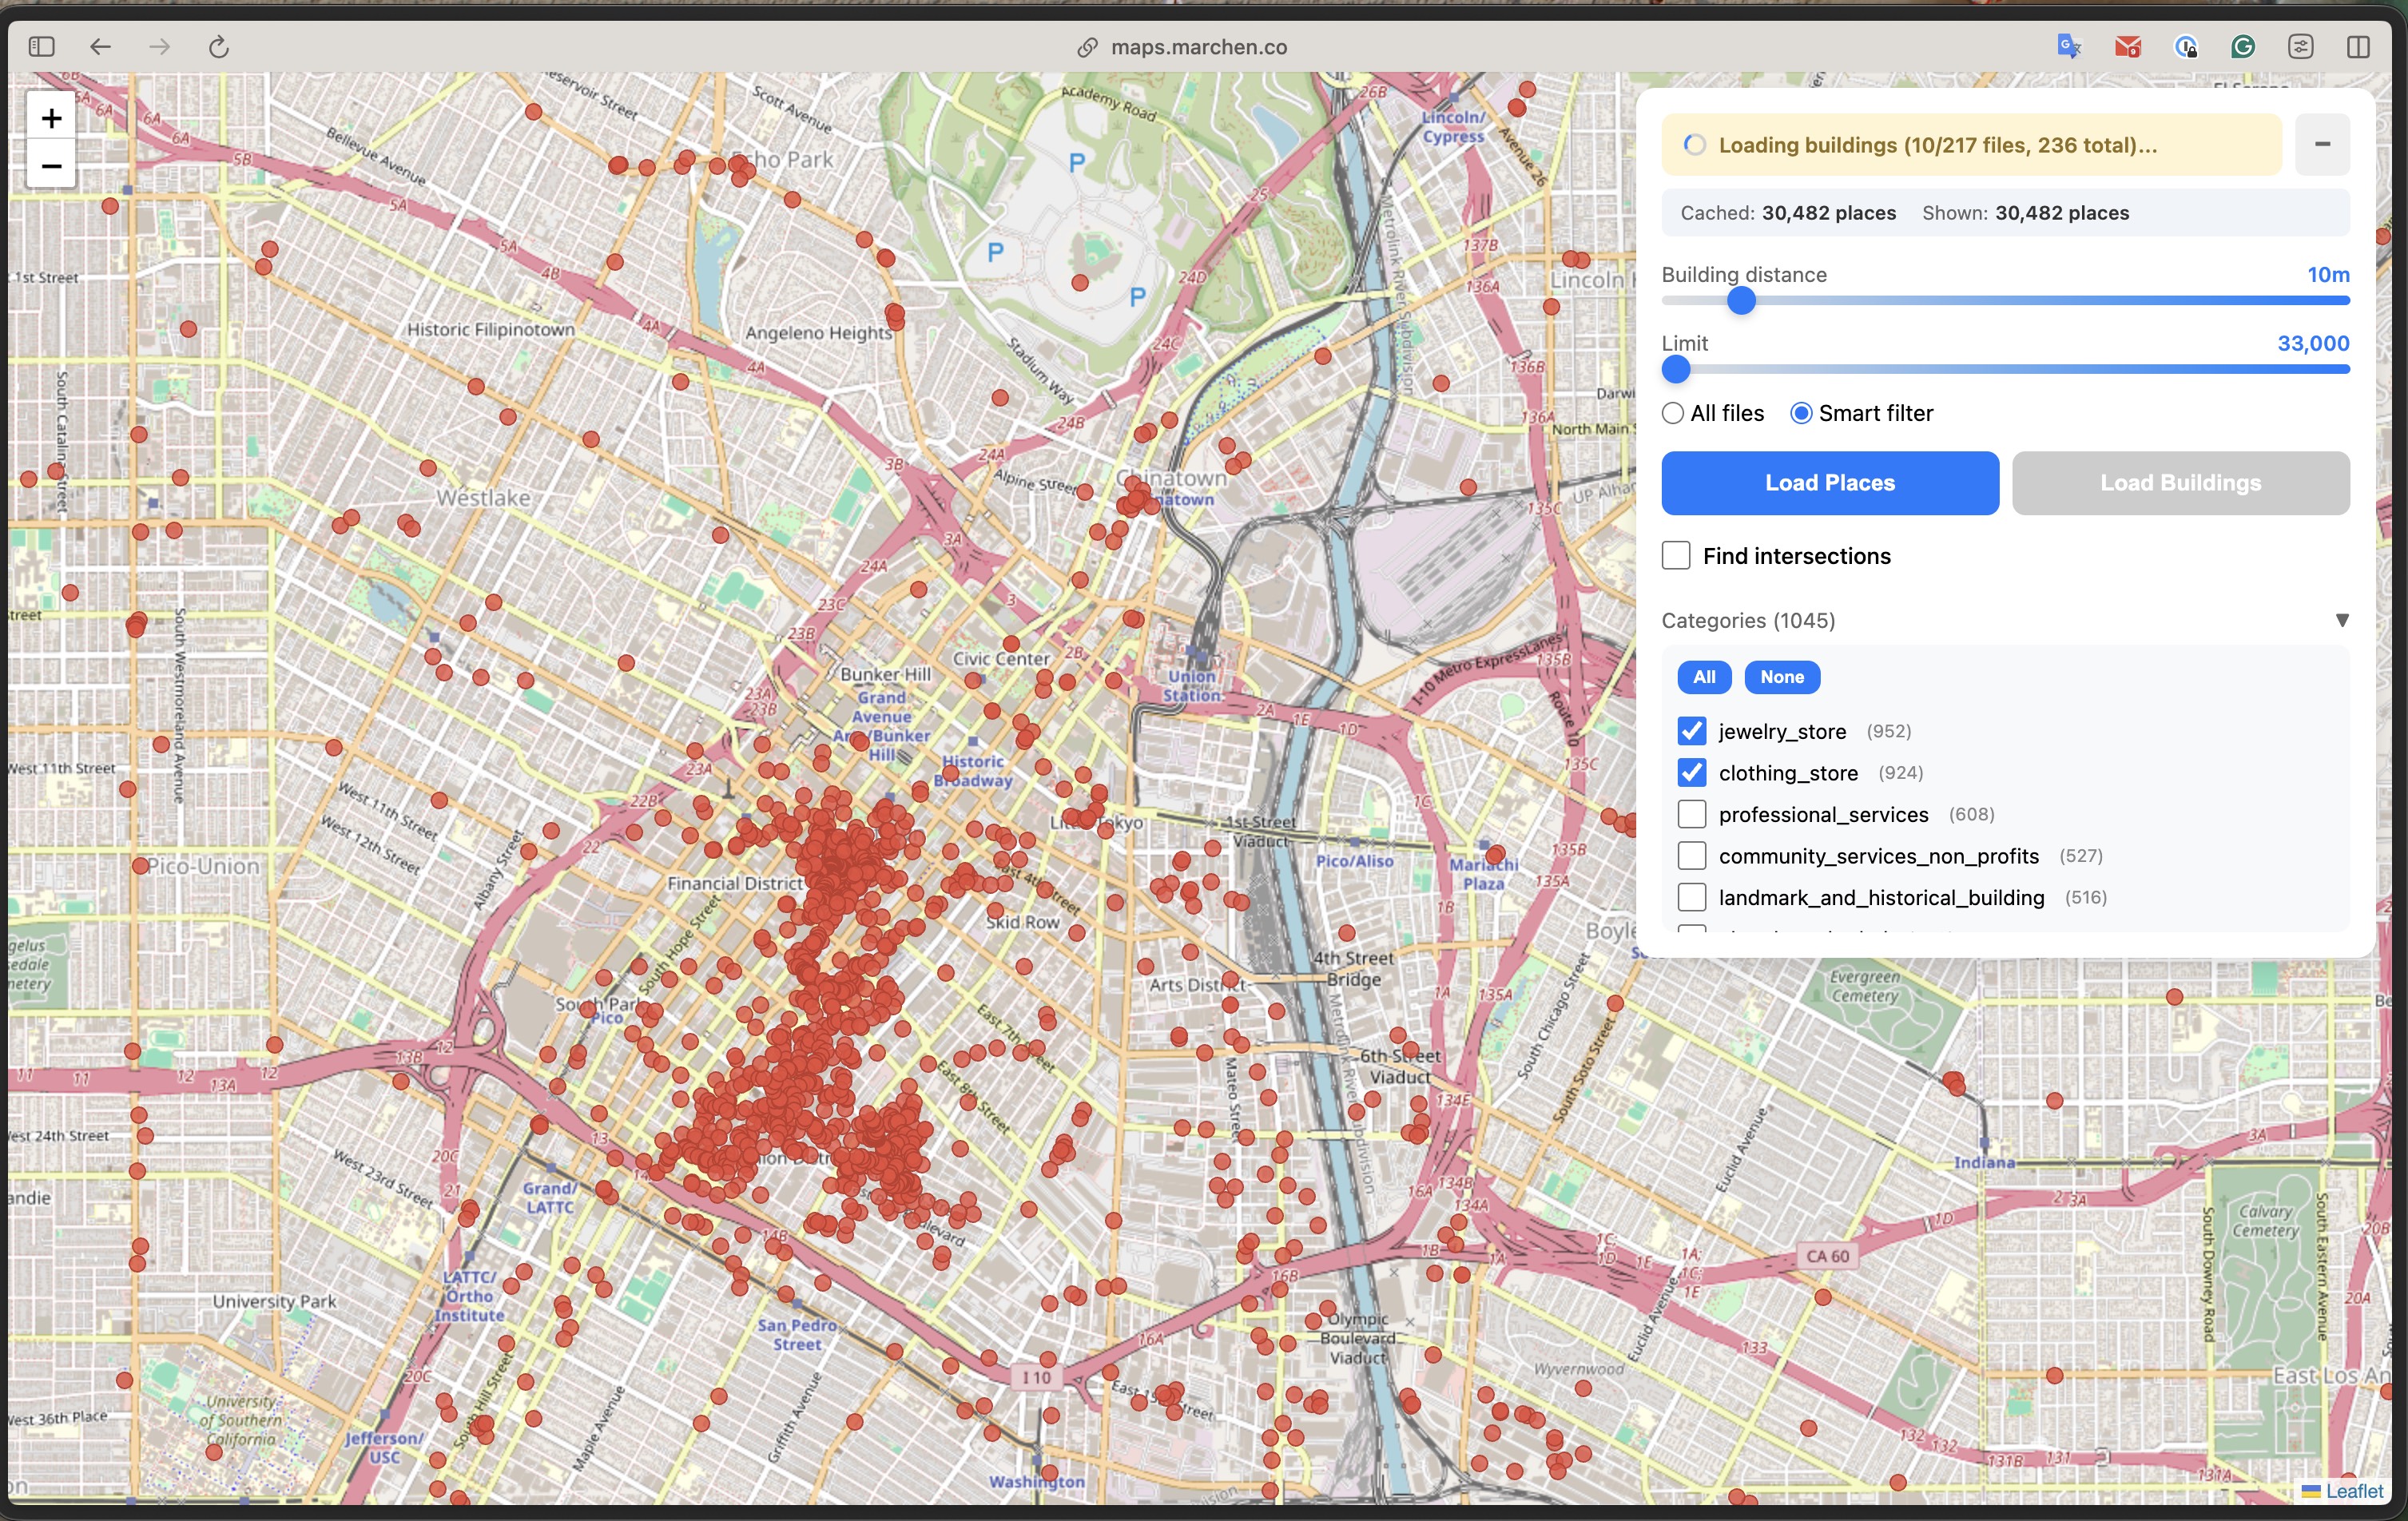
1,045 categories with live counts. Toggle any category and markers appear/disappear instantly. The data is already in memory - we're just controlling what's visible on the map.
Smart File Filtering with Parquet Metadata
Here's the real optimization. Overture Maps has 8 large Parquet files for places (~1GB each) and 236 files for buildings. Querying all of them for a small viewport is wasteful.
The solution: extract bbox metadata from Parquet files server-side and filter before the browser even sees them.
I built a Cloudflare Durable Object that reads Parquet file footers using hyparquet and extracts the min/max values of the bbox columns:
// Worker extracts bbox from Parquet row group statistics
function extractBboxFromMetadata(metadata) {
  let xmin = Infinity, xmax = -Infinity, ymin = Infinity, ymax = -Infinity;

  for (const rowGroup of metadata.row_groups) {
    for (const col of rowGroup.columns) {
      const stats = col.meta_data?.statistics;
      const path = col.meta_data?.path_in_schema?.join('.').toLowerCase();

      // Extract min/max from bbox.xmin, bbox.xmax, bbox.ymin, bbox.ymax columns
      if (path.includes('xmin')) xmin = Math.min(xmin, stats.min_value);
      if (path.includes('xmax')) xmax = Math.max(xmax, stats.max_value);
      // ...
    }
  }
  return { xmin, xmax, ymin, ymax };
}
The index is built once and cached in Durable Object storage. When the browser requests files for a bbox:
// Browser requests only relevant files
const response = await fetch(
  `${PROXY}/files/places?xmin=${bbox.west}&xmax=${bbox.east}&ymin=${bbox.south}&ymax=${bbox.north}`
);
const files = await response.json(); // Only files intersecting the viewport
The gains depend on viewport size. For a city-wide view, you might still query most files (217 of 236 in this example). For a neighborhood-level zoom, the reduction is more significant. The real benefit: the index lookup is fast (~50ms), so you know which files to query before making expensive Parquet requests.
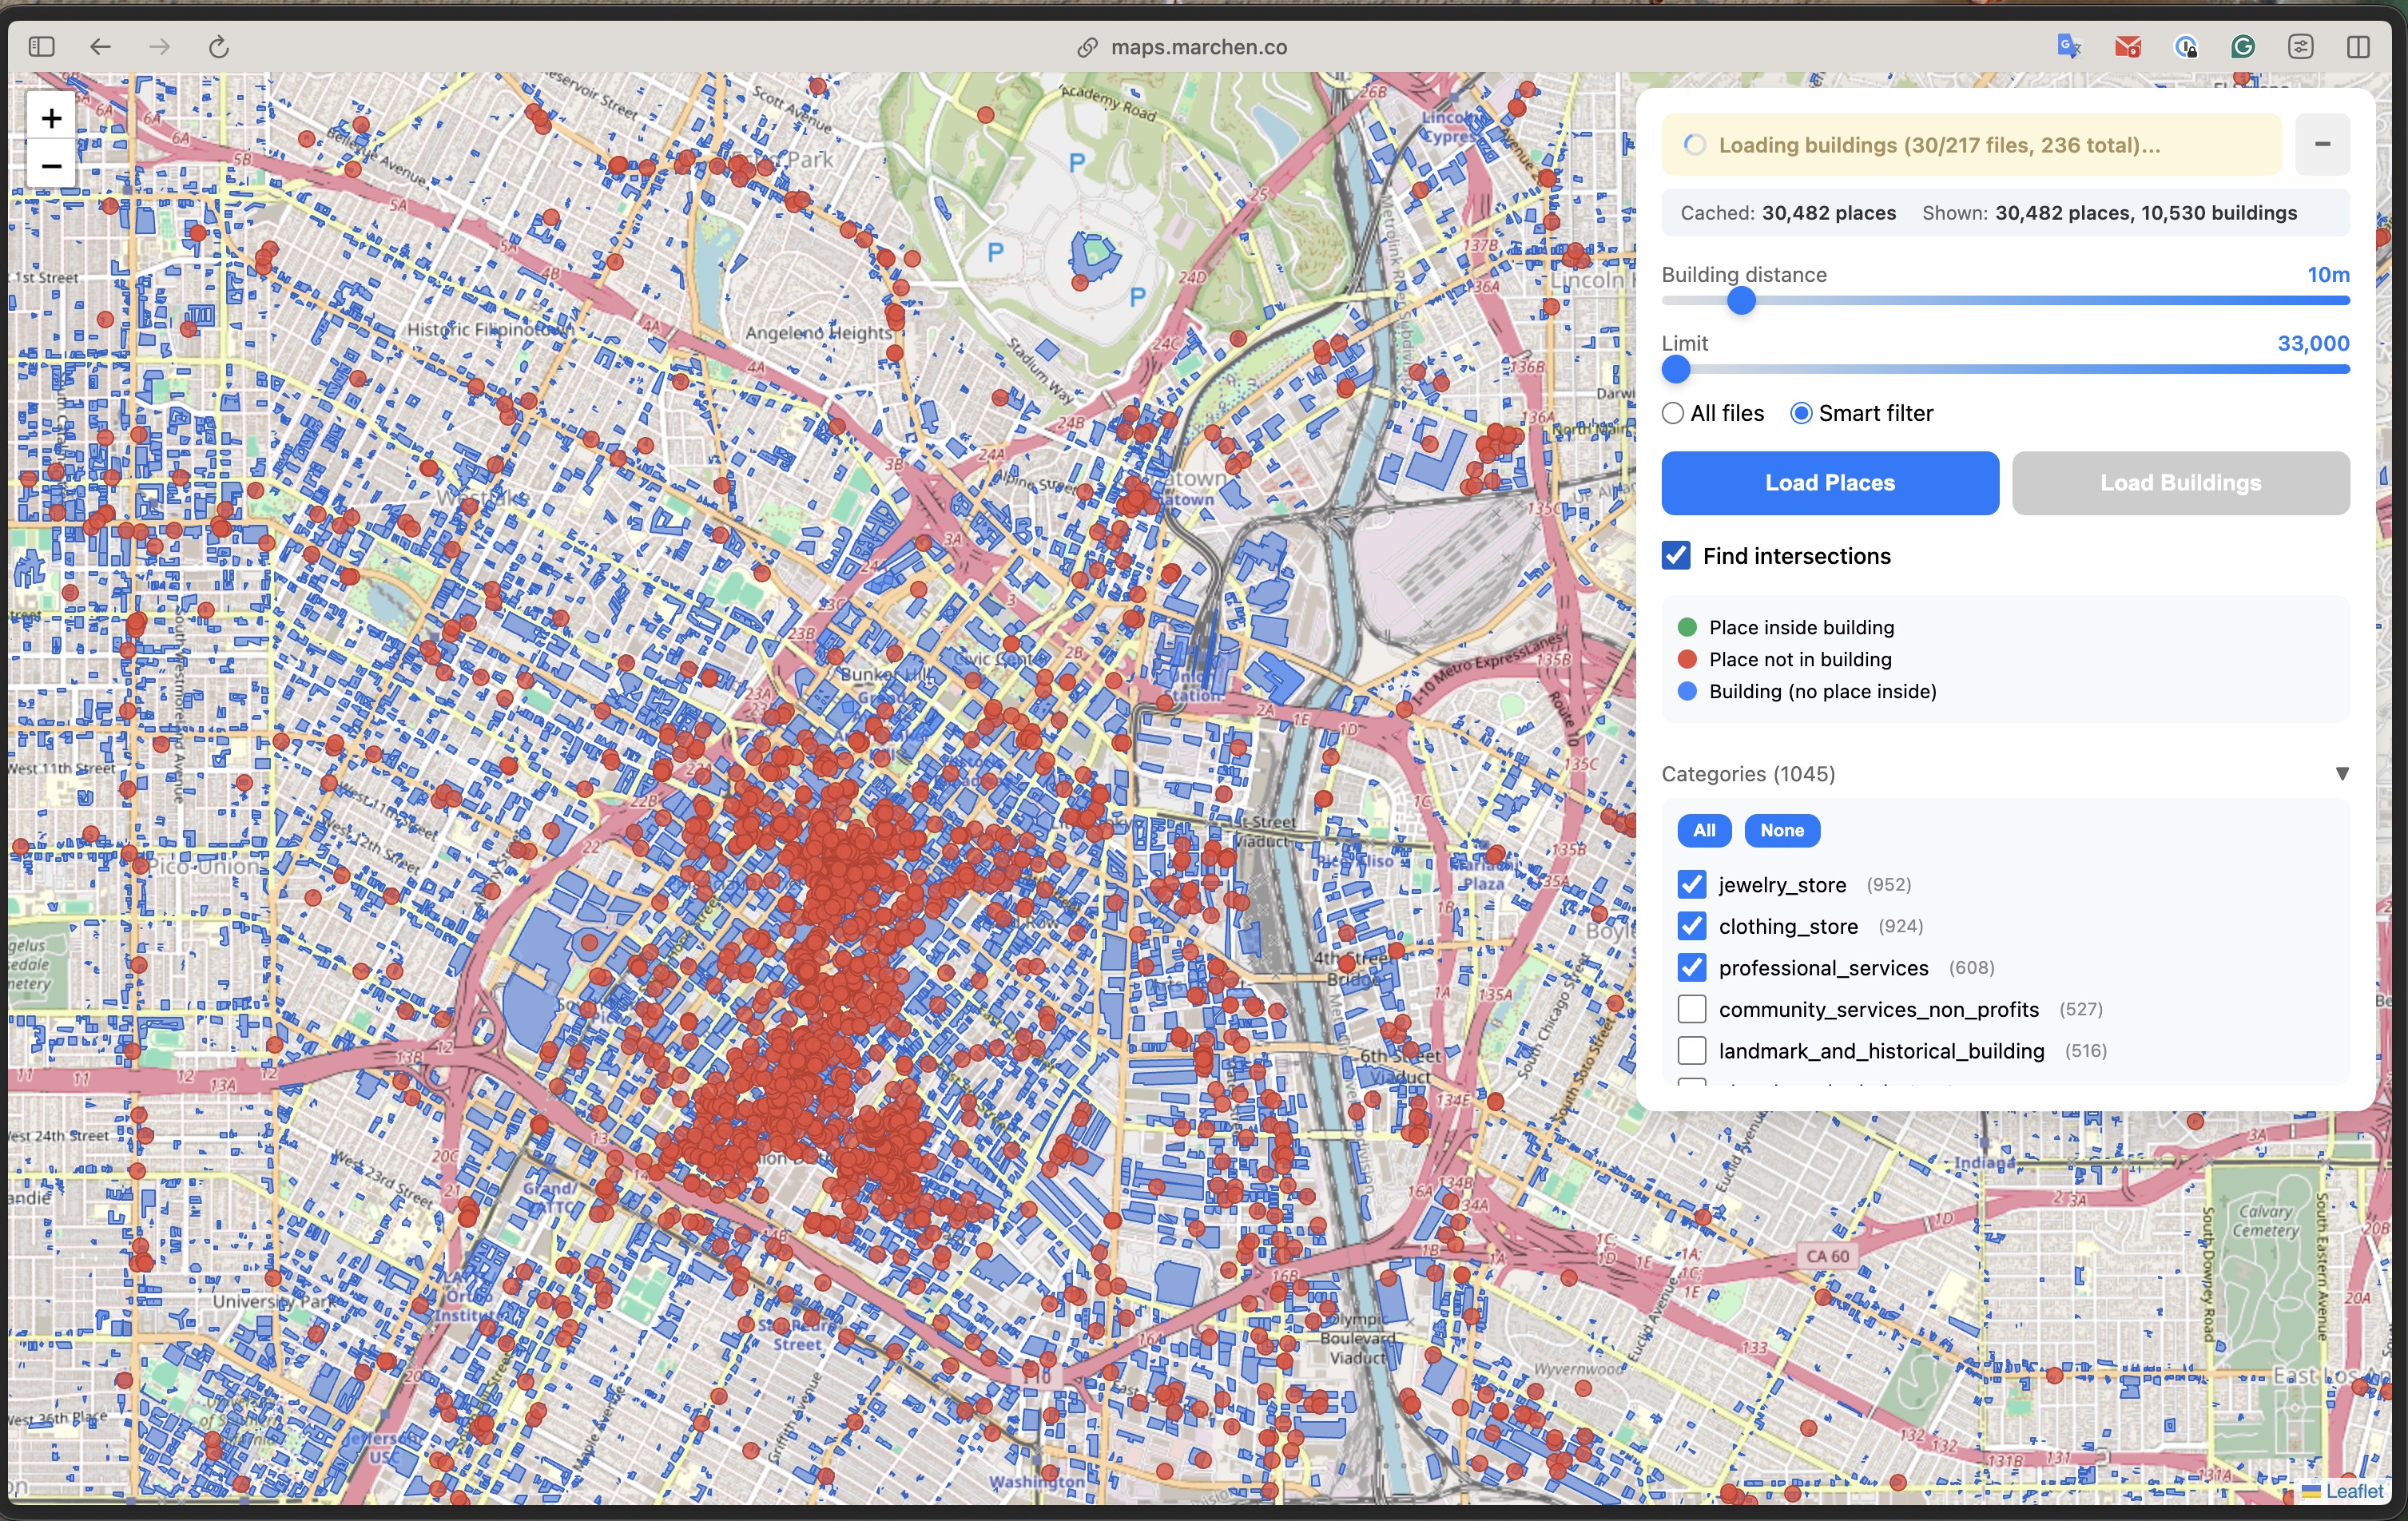
Spatial filtering in action: 217 of 236 files match this viewport. The "10/217" shows progressive loading - fetching in batches rather than all at once.
The CORS Problem
Browsers block cross-origin requests to S3. Solution: a tiny Cloudflare Worker as proxy:
export default {
  async fetch(request) {
    const url = new URL(request.url);
    const s3Url = `https://overturemaps-us-west-2.s3.amazonaws.com${url.pathname}`;

    // Forward range requests for efficient Parquet reads
    const headers = {};
    if (request.headers.has('Range')) {
      headers['Range'] = request.headers.get('Range');
    }

    const response = await fetch(s3Url, { headers });

    return new Response(response.body, {
      headers: {
        'Access-Control-Allow-Origin': '*',
        'Content-Range': response.headers.get('Content-Range'),
        // ...
      }
    });
  }
};
The full worker (~300 lines) also includes the spatial index Durable Object that handles file filtering.
Progressive Loading
Rather than waiting for all files to load before showing anything, the UI renders progressively:
for (let i = 0; i < smartFiles.length && totalLoaded < limit; i += batchSize) {
  const batch = smartFiles.slice(i, i + batchSize);
  log(`Loading places (${i + batch.length}/${smartFiles.length} files)...`);

  // Load batch into DuckDB
  await conn.query(`
    INSERT INTO places
    SELECT id, names.primary as name, categories.primary as cat,
           ST_X(geometry) as lon, ST_Y(geometry) as lat, geometry, bbox
    FROM read_parquet([${files}])
    WHERE ${bboxFilter(bbox)}
    LIMIT ${remaining}
  `);

  // Render immediately - don't wait for all files
  const newRows = await conn.query(`SELECT * FROM places LIMIT ${limit} OFFSET ${totalLoaded}`);
  for (const r of newRows) {
    const marker = L.circleMarker([r.lat, r.lon], {...});
    marker.addTo(map);
  }
  totalLoaded += newRows.length;
}
Users see data appearing on the map within seconds, even if the full query takes longer.
Performance Reality
Let's be honest about the tradeoffs:
With smart file filtering:
- File index lookup: ~50ms (cached in Durable Object)
- Places: ~25% fewer files (geo-partitioning helps here)
- Buildings: only 1-2% reduction (different partitioning strategy, less effective)
- First query for a new area: 3-10 seconds
- Progressive rendering: first results in 1-2 seconds
I timeboxed the spatial index optimization - there's room to improve, especially for buildings.
Subsequent queries (warm):
- Local table queries: <100ms
- Zooming in on cached area: instant
- Pan to adjacent area with overlap: partial cache hit
Memory usage:
- DuckDB-WASM: ~125MB baseline
- Loaded data: depends on limit slider (up to 1M features, I was able to load and render ~20M places maximum before browser crashed)
Pushing the limits: 128,699 places and 493,382 buildings loaded in a single browser tab. The "Cached" vs "Shown" stats let you track what's in memory vs what's visible in the current viewport.
Limitations
This is a proof of concept, not production-ready software. The main constraints I hit:
- Browser memory limits - Loading 500K+ features pushes against the browser's heap limit. DuckDB-WASM plus Leaflet markers eat through memory fast.
- Cold start latency - First load takes 3-10 seconds. Not acceptable for consumer apps.
- Mobile is rough - WASM bundle size + memory pressure = bad experience on phones.
For a real production app, I'd look at PMTiles (pre-tiled vector data) for fast visualization, then drop into DuckDB-WASM only for detailed analysis queries.
The Code
Everything is open source: github.com/nikmarch/overturemaps-duckdb
The stack:
- hyparquet - reads Parquet metadata without full file download
- DuckDB-WASM - SQL engine with spatial extension
- Leaflet - map rendering
- Cloudflare Workers - edge proxy with Durable Objects for state
Building with Claude
This project was built iteratively with Claude (Opus) as a coding partner, running on my home server Zarbazan.
For prototyping, it's excellent. The first working version came together in hours. But it's not magic - sometimes I needed to remind Claude about specific protocols, explain how certain APIs actually behave, or walk through tricks I'd learned from experience. The knowledge flows both ways.
What impressed me most: how naturally Claude works with bash tooling. Checking network requests, debugging Docker containers, iterating on configuration files - it felt like pair programming with someone who's genuinely curious about the problem space. We'd both discover things along the way.
The code isn't perfect, but it works. And the iteration speed let me explore ideas I might have skipped if building alone.
What I Learned
Parquet metadata is powerful. By reading just the file footer (~few KB), you can determine if a file contains relevant data. This enables smart filtering without touching the actual records.
DuckDB-WASM is production-ready. The spatial extension works, window functions work, CTEs work. It's not a toy - it's a real analytical database that happens to run in a browser tab.
The edge is the new backend. Cloudflare Workers + Durable Objects gave me server-side state (the spatial index) without managing servers. The index builds once and persists across requests.
SQL as state management works. Instead of Redux or Zustand, I have DuckDB tables. Instead of selectors, I have queries. It's a different mental model, but surprisingly natural for data-heavy UIs.
The SQL-First Vision
This experiment points to a different way of building data-intensive frontends:
Traditional approach:
User action → State update → API call → Response → State update → Re-render
SQL-first approach:
User action → SQL query → Render results
The database is the state. Filtering, joining, aggregating - these aren't backend concerns anymore. They're just queries.
This won't replace React or traditional state management for most apps. But for data exploration, analytics dashboards, and tools where users interact with structured data? SQL in the browser is a compelling alternative.
Conclusion
This started as an experiment with four questions:
- Can Claude be an effective coding partner? Yes - the iteration speed was remarkable
- Can open data be used without infrastructure? Yes - GeoParquet + HTTP range requests make it practical
- Can SQL work as frontend state? Yes - and it's surprisingly elegant for the right use cases
- Can I learn Cloudflare's platform by building? Yes - Workers, Durable Objects, Pages, and the Cache API all clicked once I had a real use case
The browser has become capable of things we used to need servers for. DuckDB-WASM, Parquet, and edge computing have shifted what's possible.
The mental shift: treat your frontend as a SQL client, not a REST consumer.
Your "API" becomes S3 buckets full of Parquet files. Your "database" runs in the browser. Your infrastructure bill stays at zero. And your AI pair programmer helps you iterate faster than ever.
Zoomed in: individual building footprints (green = contains places, blue = no places), place markers, and a popup showing "La Grande Station - train_station". All data queried via SQL in the browser.
Try it yourself at maps.marchen.co. Pan to your city, load places and buildings, and run spatial SQL queries against 2.3 billion features - all in your browser.